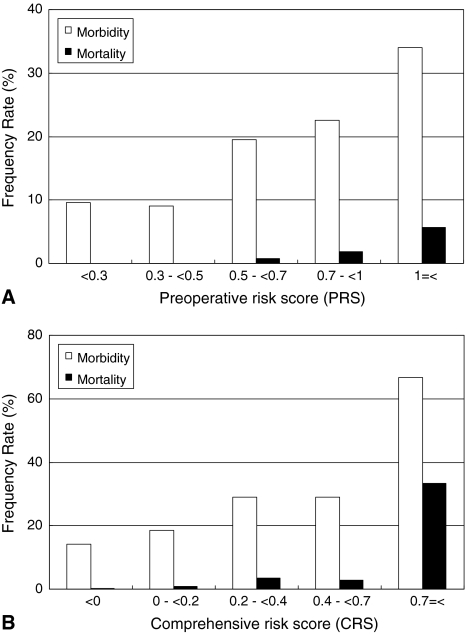
Fig. 1A–B.
(A) The bar chart shows the relationship between the preoperative risk score (PRS) and postoperative morbidity and mortality rates. The PRS correlated significantly with morbidity rates (ρ = 0.16, p < 0.0001) and mortality rates (ρ = 0.14, p = 0.0001). (B) The bar chart shows the relationship between the comprehensive risk score (CRS) and postoperative morbidity and mortality rates. The CRS correlated significantly with morbidity rates (ρ = 0.18, p < 0.0001) and mortality rates (ρ = 0.14, p = 0.0001).

