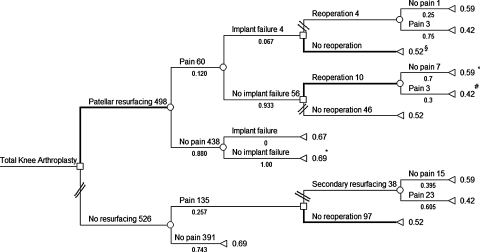
Fig. 2.
The completed decision tree shows the probabilities as calculated from RCT trials and the utilities based on the McKnee modified health utility index. The path probabilities on the optimal pathway are as follows: §path probability = 0.008; °path probability = 0.078; #path probability = 0.034; *path probability = 0.880. The remaining path probabilities were not calculated as they are not on the optimal pathway.

