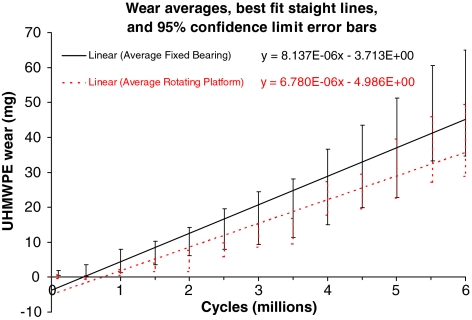
Fig. 7.
Wear curves of each design type (rotating platform versus fixed bearing) were averaged together and compared. The equations shown are the least square error regression lines with a free intercept (not forced through 0). The 95% confidence limits at each stage are shown as error bars and clearly overlap each other.

