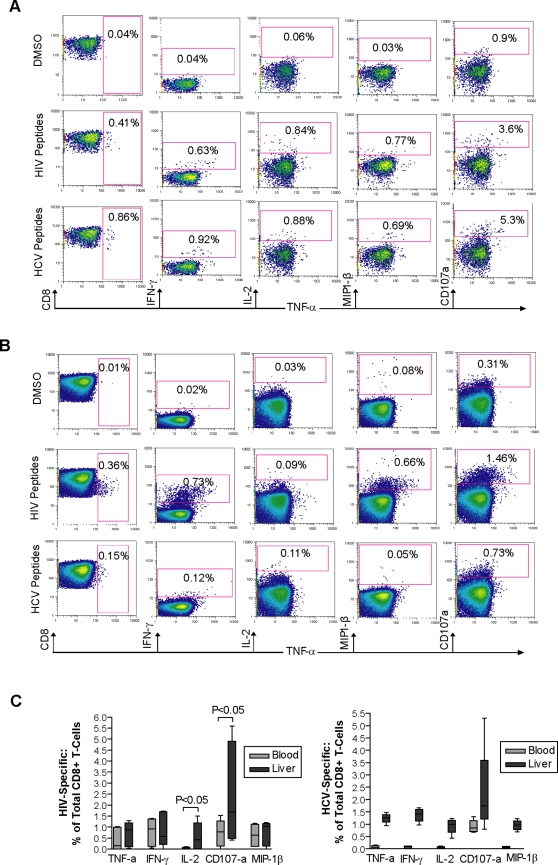
Figure 3. Polychromatic FACS analysis of viral-specific T cells in HCV/HIV co-infection.
Shown are representative FACS data of the HIV and HCV specific multi-parameter CD8+ T-cell responses from (a) liver and (b) blood of subject OM 405, a therapy-naïve HCV/HIV co-infected individual, after in vitro stimulation using pool of HIV and HCV peptides. Initial gating on forward scatter area (FSC-A) versus height (FSC-H) was used to remove doublets. The events were further gated on forward scatter (FSC) versus the dead cell marker to remove dead cells. Lymphocytes were gated on the remaining live cells on a FSC versus SSC plot. Gates on CD3+/CD8+ cells were then generated. All responses are gated on a CD3+/CD8+ population and presented against TNF-α on the x-axis. Figure (c) shows a comparison of the frequency of HIV and HCV-specific CD8+ T-cells in the liver and blood of therapy-naïve, co-infected individuals. All intra-hepatic HCV-specific responses are significantly stronger than peripheral HCV-specific responses.

