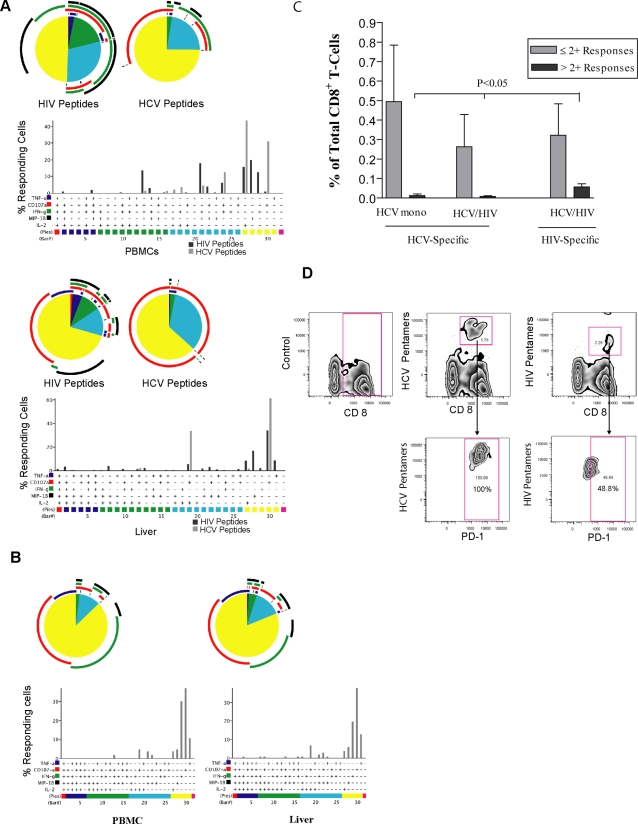
Figure 5. Characterization of the functional hierarchy of viral specific CD8+ T-cells in HCV/HIV co-infection.
Representative functional profiles of virus specific CD8+ T-cells in blood and liver are depicted from an individual with (a) HCV/HIV co-infection (OM 405) and from an individual with (b) HCV mono-infection (OM 428). For multi-parameter analysis, the Boolean gating platform was used to create all of the possible combinations of functions, generating 32 response patterns for 5 of the different functions analyzed. All data are reported after background correction. Nonspecific background is shown to become extremely low when examining combinations of functions, nearly reaching 0 events for multiple functions simultaneously. This permits a very low threshold for detection of positive responses from multiple combinations. Consequently, for multi-parameter analysis, the results were thresholded based on a minimum criterion of positivity, as calculated by SPICE software and presented as the 90th percentile of negative values for each analysis. Each pie chart generated by SPICE software, represents the hierarchy of responses to either HCV or HIV antigen stimulation. For simplicity, responses are grouped by number of functions and matched to the colored bars, with black bars representing the percentage of responding cells to HIV peptides and gray bars representing the percentage of responses to HCV peptide stimulation. In all pie charts, color red represents the 5+ responding population and the colors blue, green, turquoise, and yellow representing the 4+, 3+, 2+, and 1+ populations respectively. Color-coded arcs represent the dominant marker within each pie slice, with color blue representing TNF-α, red for CD107-a, green for IFN-γ and black for MIP-1β. Although IL-2 is included in the presentation and demonstrated by bar graphs, the software would not allow for arc colors for more than 4 responses. As a result there is no arc representative for IL-2. Figure (c) represents the average frequency of intra-hepatic viral specific responses within the pool of CD8+ T-cell populations simultaneously expressing 2 functions or less, compared with those within the pool of populations expressing more than 2 functions simultaneously; as analyzed in 3 subjects within each cohort of HCV mono and HCV/HIV co-infected individuals. The cutoff point of simultaneous expression of more than 2 measured markers is considered to show CD8+ T-cell poly-functionality. Figure (d) represents PD-1 levels on HIV-1 and HCV-specific T-cells from HCV/HIV Co-infected liver (OM 385). Liver cells were stained with two pools of HLA-A*0201-restricted pentamers (Proimmune): HCV pentamers: NS3-CINGVCWTV, NS3-KLVALGINAV and HIV pentamers: Pol-ILKEPVHGV, Gag p24-TLNAWVKVV. PD-1 gating was based on FMO (fluorescence minus one) of the control sample.

