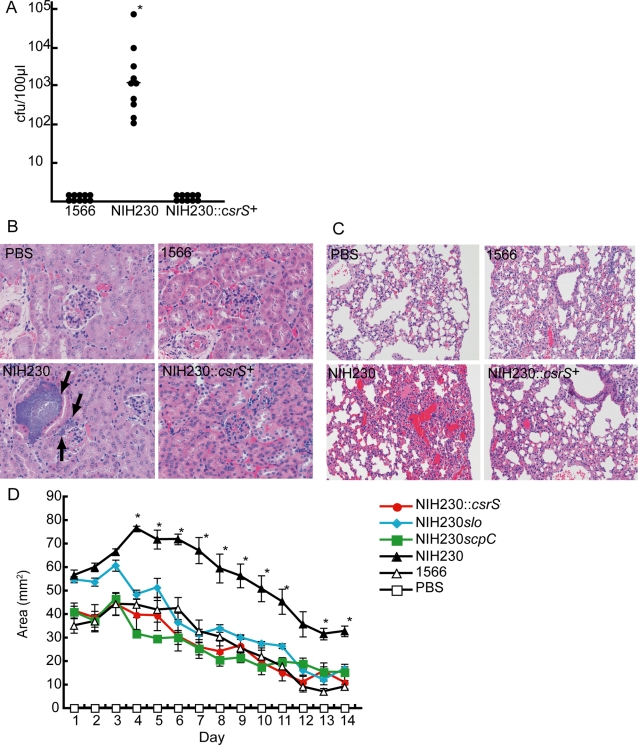
Figure 7. Mutations of the csrS, SLO and ScpC regulate in vivo virulence of GAS in a mouse model.
(A) Number of GAS organisms recovered from the blood (100 µL) of each Male ddY mice injected intravenously with 1×10⁷ CFU in 100 ml suspension of GAS in PBS. Blood was taken 24 h after injection and the bacterial count was determined after plating on agar. The (-) bar represents median values. *(p<0.05) estimated by ANOVA. Histopathological changes in the (B) kidney and (C) lungs of mice infected with GAS. Each tissue was extracted 24 h after injecting GAS (1×10⁷ CFU). The black arrows indicate clusters of bacteria. (D) The course of subcutaneous infection in hairless mice injected with 1×10⁷ CFU in 100 µL suspension of GAS in PBS. Lesion area and body weight were measured daily after infection. Values are mean±SEM (n = 5). *Area of skin lesion in NIH230 infected mice was significantly higher than all other groups (p<0.05) estimated by ANOVA.

