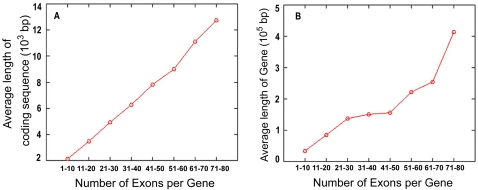
Figure 4. Direct correlation of the number of exons per gene, length of coding sequence, and length of gene.
The number of exons, length of coding sequence, and length of gene for each gene in the human genome were tabulated from the EuSplice database [41]. The number of genes with specified number of exons was recorded, and the average lengths of the coding sequence and the gene for this dataset were computed. The average lengths of the coding sequence and the gene were plotted as a function of increasing number of exons per gene up to 80 exons per gene. The figure shows (A) length of coding sequence and (B) length of gene as a function of increasing number of exons per gene.

