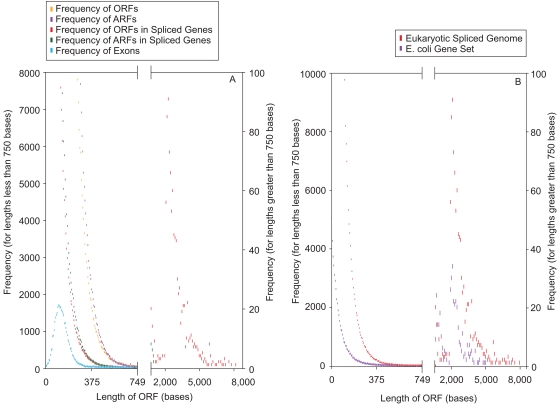
Figure 5. Specific generation of non-conforming ORFs due to exon splicing.
(A) Human genes with a complete coding sequence (spliced-exons) >2000 bases and a gene sequence devoid of ORFs >750 bases were selected. The ORF and ARF lengths were computed in all three RFs of each of these genes, and their combined frequencies were plotted. The frequencies of the lengths of exons from this set of genes were also plotted. Next, the exons from each gene were spliced to form its coding sequence and the frequency distribution of ORF and ARF lengths from the spliced sequences were plotted. The X-axis was broken into two parts: from 0–749 bases and from 750–10000 bases. The Y-axis scales corresponding to 0–749 bases are shown on the left, and those corresponding to 750–10000 bases are shown on the right. The frequencies corresponding to 0–749 bases were binned for every 6 consecutive ORF/ARF/exon lengths and the frequencies corresponding to 750–10000 bases were binned every 100 consecutive ORF/ARF lengths. (B) Frequency distribution of ORF lengths in prokaryotic genes. All the genes from the E. coli K12 genome, each of whose coding sequence length was at least 2000 bases, were selected. The ORF lengths in all three RFs of each of these genes were computed and their combined frequencies plotted. The ORF length frequency from the spliced sequences of the >2000 base human gene set (Figure 3A) was overlaid for comparison. The methods used for line break, binning and plotting are the same as in Figure 3A.

