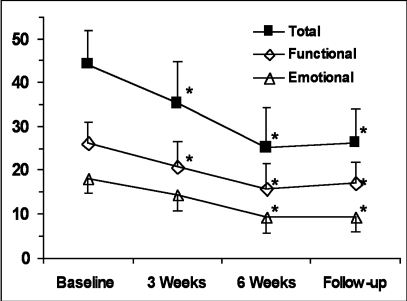
Figure 4.
Headache Disability Index. Mean scores for the Total as well as Functional and Emotional subscales of the HDI are presented (±95% CI). The test was administered five times at three-week intervals, including twice during Baseline. No statistical difference was detected between Baseline scores (P=0.94) and were subsequently pooled. A significant change across time was noted for Total score and each subscale (P<0.001). HDI denotes Headache Disability Index; * denotes P<0.01 from respective Baseline value.

