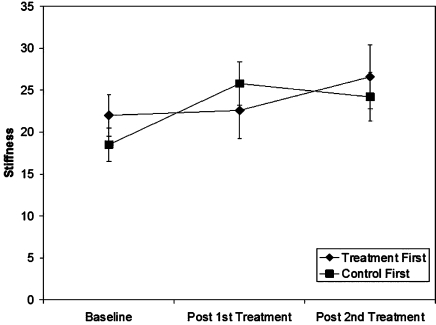
Figure 3.
Estimates of posterior talocrural joint stiffness means (± SE) for both groups at each testing interval. Stiffness was estimated as the slope of the force-displacement curve from the arthrometer testing. There was not a significant time by group interaction (p=.19), but there was a significant time main effect (p=.04). Regardless of group membership, there was increased stiffness at the last testing interval compared to baseline.

