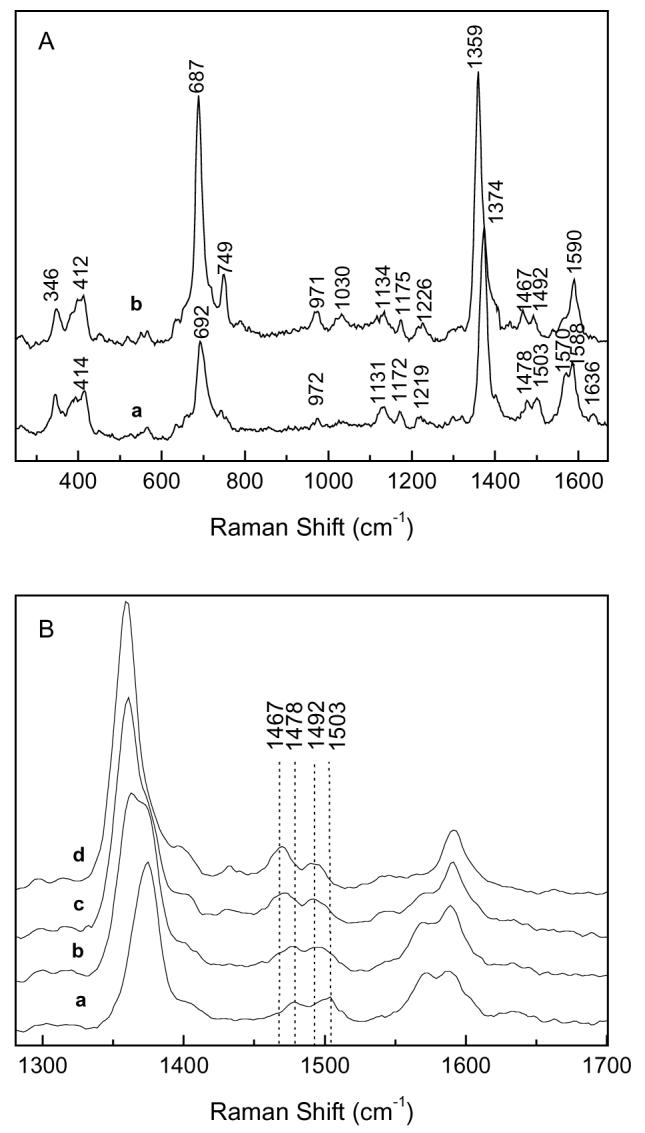
Figure 4.

Resonance Raman Spectra of different redox states of MauG. A. Spectra of fully oxidized (a) and fully reduced (b) MauG. B. Spectral changes occurring during reduction of MauG by incremental additions of sodium dithionite: fully oxidized MauG (a), partially reduced MauG (b and c), and fully reduced MauG (d). Protein concentrations were 0.25 mM.
