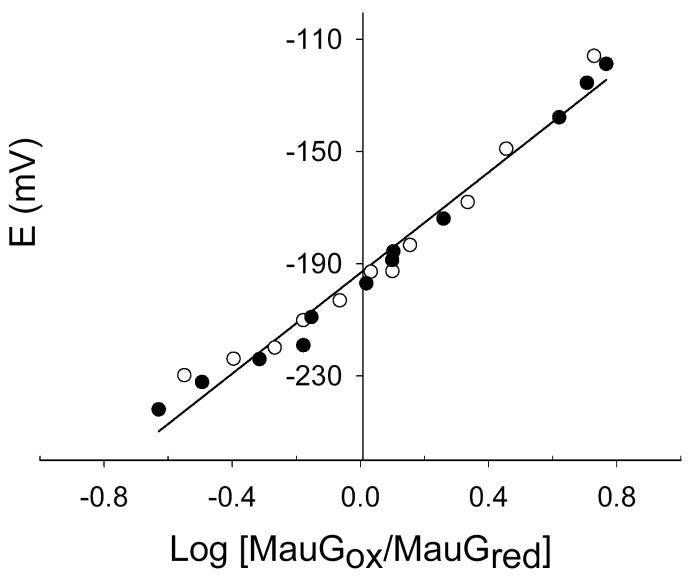
Figure 6.
Nernst plot for the reductive titration of MauG in the presence of FMN as a mediator. Experimental points from the forward and reverse reductive (closed circles) and oxidative (open circles) titrations are shown. Values of log MauGox/MauGred were obtained from the absorbance changes at 550 nm. The straight line shows the fit of these data to eq 3 which yields a slope 90 mV (n=0.67) and intercept of −193 mV.

