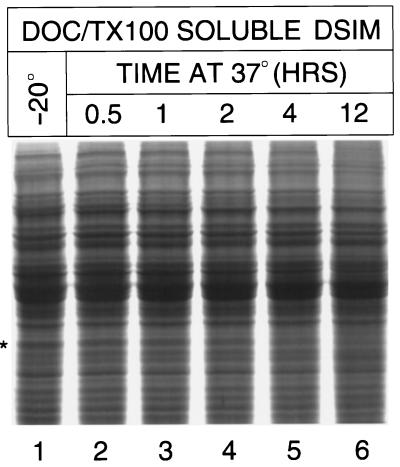
Figure 2.
Time course of SCD degradation. DSIMs were solubilized with DOC/TX100. Insoluble proteins were removed by ultracentrifugation. The soluble protein fraction was incubated at 37°C for the indicated times, subjected to SDS-PAGE, and stained with Coomassie blue. Time points analyzed were 0 h (lane 1), 0.5 h (lane 2), 1 h (lane 3), 2 h (lane 4), 4 h (lane 5), and 12 h (lane 6). The SCD protein band is marked with an asterisk to the left of lane 1.

