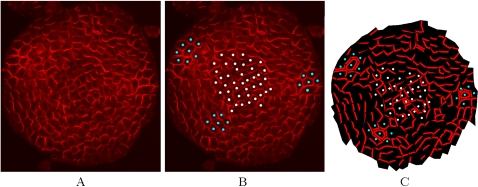
Figure 6. SAM digitalization.
(A) shows the PIN distribution in a real meristem obtained using immunolabelling (top view). (B) shows the same image with marked primordia cells (blue dots) and central zone cells (white dots). (C) shows the reproduction of PIN distribution and polarity in a digitized version of the same image.

