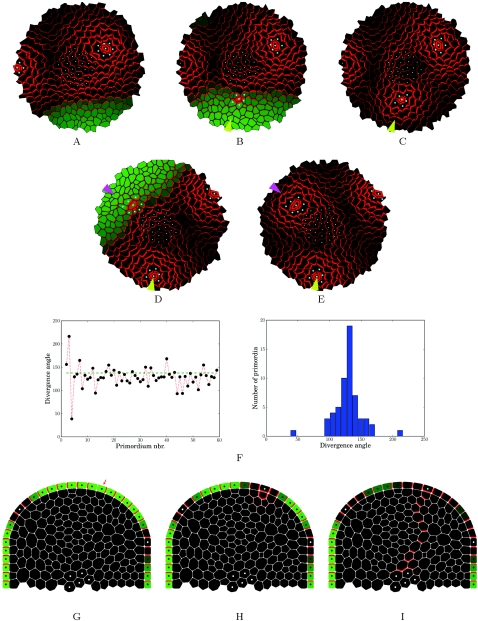
Figure 9. Dynamic models.
(A–E) 2D top view of a virtual meristem following the flux-based model showing the dynamics of PIN distribution, auxin concentrations and primordia initiation. The sequence shows the initiation of two consecutive primordia (arrowheads). The sequence starts with auxin accumulation in the zone that is the farthest away from the existing primordia. When a threshold is reached, the maximum acquires primordium identity and becomes a sink. (F) shows the variation of the angles between 65 consecutive primordia. Note that the mean value is close to the golden angle (137°5) typical for spiralled phyllotaxis as observed in Arabidopsis. (G–I) 2D transversal cut of a virtual meristem following the flux-based model showing the dynamics of PIN distribution, leading to the formation of a provascular strand of cells that transport auxin downwards. Detailed description in the text.

