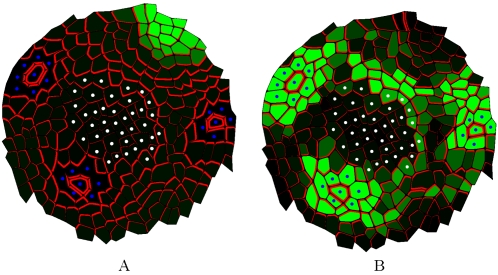
Figure 12. The simulation 7B results showing the predicted levels of auxin concentration (A) and flux intensity (B).
The simulation 7B results showing the predicted levels of auxin concentration (A) and flux intensity (B). Note the sharp peaks observed in (B), comparable to DR5rev:GFP peaks observed in vivo [10].

