
Fig. 1.
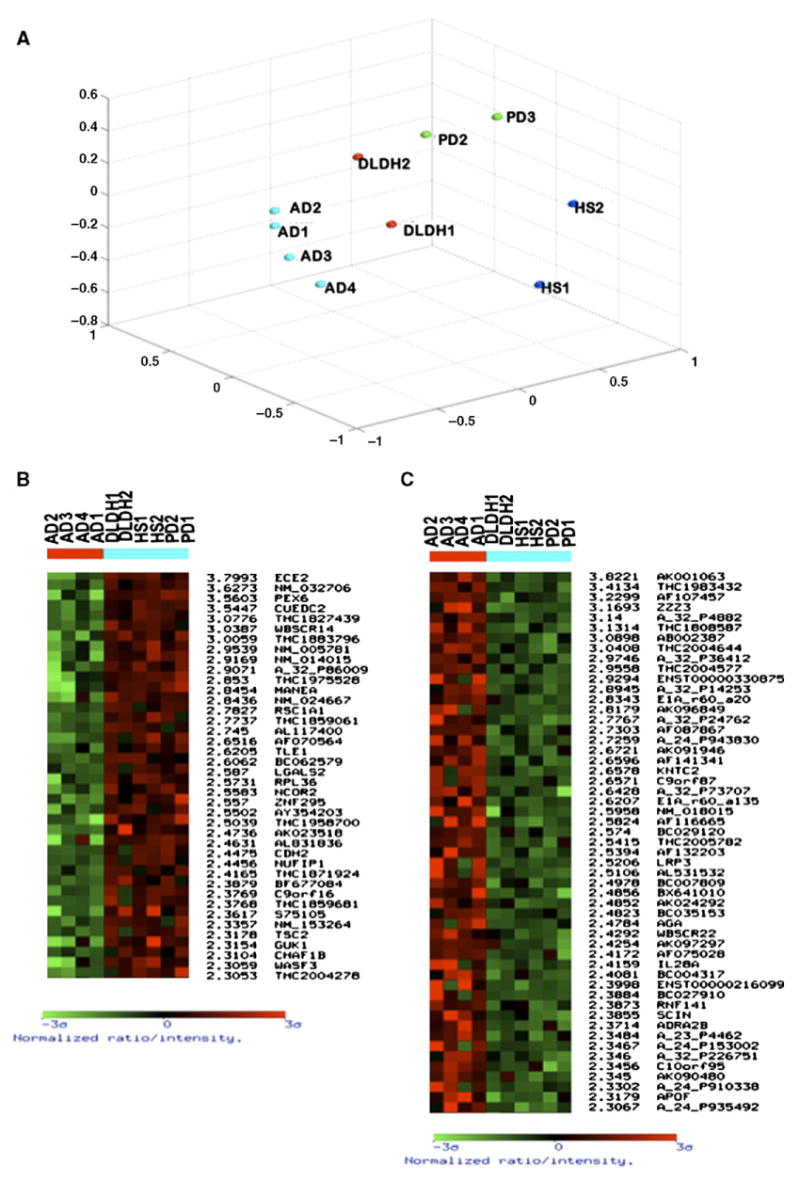
Microarray analysis of the IPL of AD versus non-AD-related dementia patients. The IPLs of four AD patients and six patients representing other non-AD-related dementias were subjected to array analysis using whole genome chips (Agilent, 44K). (A) Multidimensional scaling analysis demonstrates that the AD patients segregate together, demonstrating that they have a specific gene expression profile distinct from the other types of dementia. The weighted gene lists shows genes with a significance of 2.3 or higher including the top 40 downregulated genes (B) and the top 50+ upregulated genes (C) as compared to both control and other non-AD-related dementia samples.