
Figure 1.
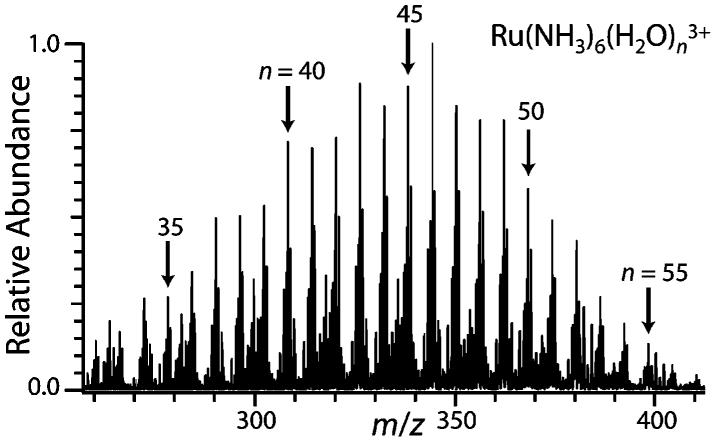
ESI mass spectrum of ∼2 mM aqueous Ru(NH3)63+ showing hydrated clusters, Ru(NH3)6(H2O)n3+, with n indicated in the figure.
Official websites use .gov
A
.gov website belongs to an official
government organization in the United States.
Secure .gov websites use HTTPS
A lock (
) or https:// means you've safely
connected to the .gov website. Share sensitive
information only on official, secure websites.
ESI mass spectrum of ∼2 mM aqueous Ru(NH3)63+ showing hydrated clusters, Ru(NH3)6(H2O)n3+, with n indicated in the figure.