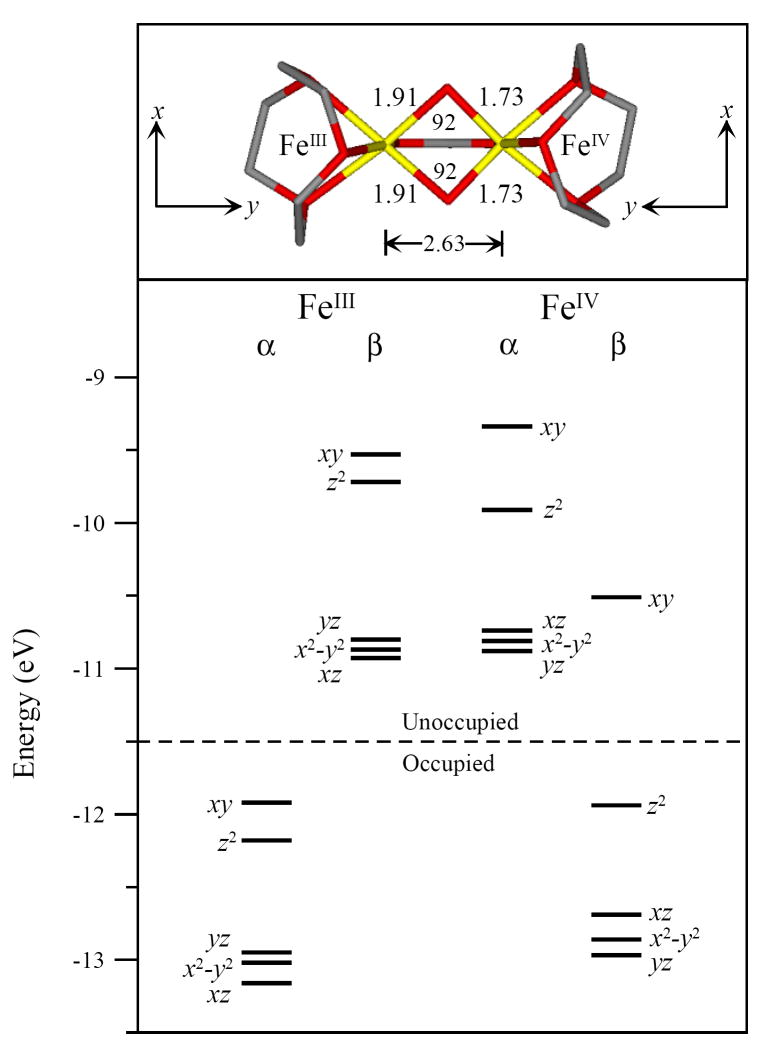
Figure 9.
Energy level diagram of the Stot=1/2 unrestricted DFT geometry optimized bis-μ-oxo, [FeIII(μ-O)2FeIV] core structure. The top portion displays the bis-μ-oxo structure with Fe-O and Fe-Fe distance and angle data. Local coordinate frames are displayed for each iron. Ligand hydrogens are omitted for clarity.

