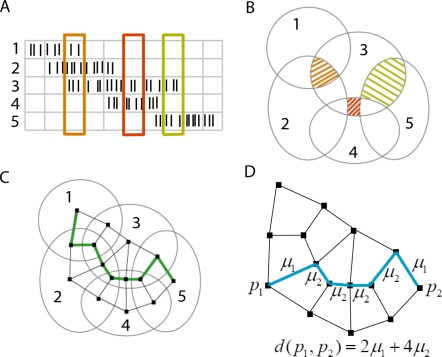
Figure 3. Construction of a metric on cell groups.
(A) Example spike trains from five place cells. Each time bin (columns) represents two theta cycles. (B) Place field intersection pattern derived from cell groups in (A). Shaded regions correspond to cell groups inside rectangles of the same color in (A). (C) The pattern of intersections can be represented by a graph, with vertices (black squares) for each cell group, and edges connecting neighbors (cell groups that differ by one cell only). A trajectory (green) is inferred from the example data, by “connecting the dots” to match the sequence of cell groups in (A). (D) Weights are assigned to edges of the graph using the dissimilarity index μk, where k is the number of common cells between neighbors. The distance between any two vertices in the graph is obtained by summing the weights along a shortest path (blue).

