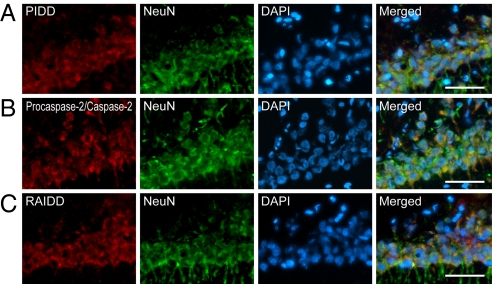
Fig. 2.
Neuronal expression of PIDD, procaspase-2/caspase-2, and RAIDD in the hippocampal CA1 subregion after tGCI. Fluorescent double staining of PIDD (A), procaspase-2/caspase-2 (B), or RAIDD (red) (C), and NeuN (green) in the hippocampal CA1 subregion. Nuclei were counterstained with DAPI (blue). NeuN showed neuronal distribution. Merged images demonstrate that PIDD-, RAIDD- and procaspase-2/caspase-2-positive cells co-localized with neurons. Scale bars, 50 μm.

