
Fig. 2.
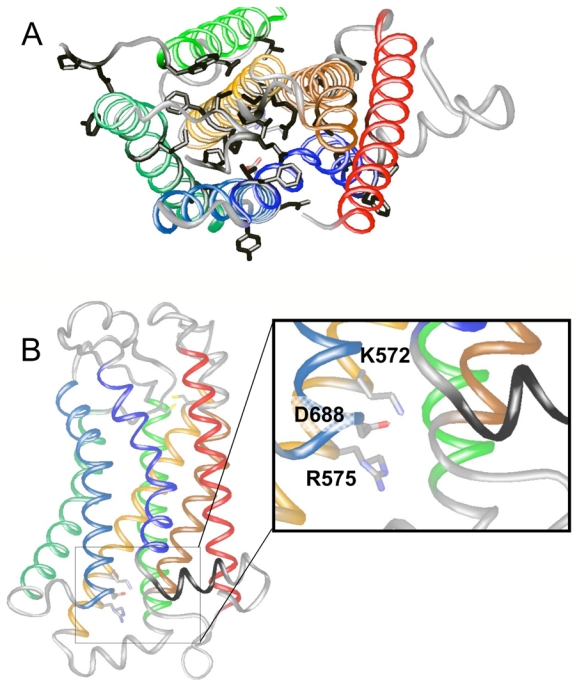
Molecular modeling of GABAB2. A. The side chains of the residues conserved in the GABAB subunits from different species (rat, human, coenorhabditis elegans, and drosophila melanogaster) are showed in black. The representation of the model is viewed from the extracellular side, with the helical TMs showed in ribbon representation. B. The residues K572 and R575 in TM3, and D688 in TM6, are shown in wireframe and in color according to the atom types. The two cysteins conserved in the class C receptors and corresponding to the conserved cysteins in class A receptors involved in a disulfide bridge at the extracellular face are also showed. The representation of the model is viewed from the side and shows the helical TMs in ribbon representation. Loops are shown in white/grey, while TMs are colored as following: TM1 in red, TM2 in brown, TM3 in orange, TM4 in green, TM5 in dark green, TM6 in cyan, and TM7 in dark blue. The figures have been made using the program ViTO.