
Fig. 9.
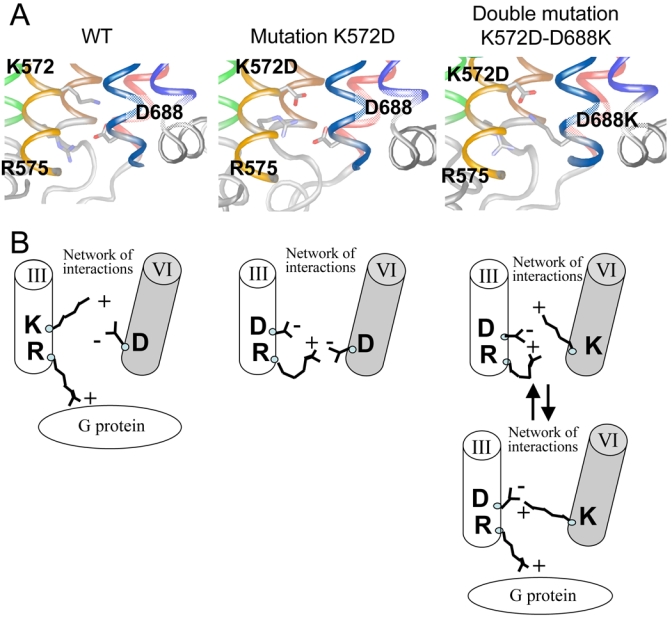
Putative functional role of the residues K572, R575, and D688 at the interface of the TM3 and TM6 of GABAB2. A. Three-dimensional model of the mutated GABAB2. For clarity, only the region of the mutated residues (K572, R575, and D688) is shown. The structure rendering and the color code used are as in Fig 2. B. Schematic representation of the putative effect of the mutation K572D and of the reversing effect of the double mutation K572D-D688K in GABAB2 deduced from the experimental data and the structural analysis.