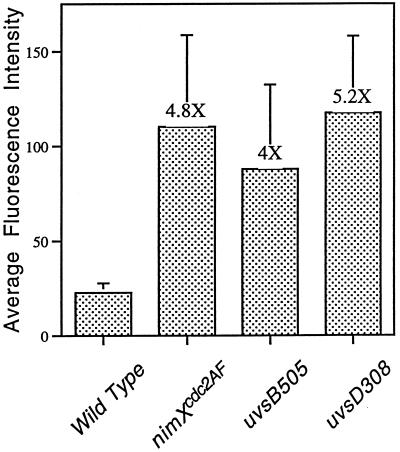
Figure 7.
Comparison of the relative DNA content of cells undergoing DNA replication. Average fluorescence intensity of nuclei in 12 cells (6 cells from two independent experiments) of the indicated strains germinated in the presence of 6 mM HU for 12 h. Error bars represent the SD observed for each strain.

