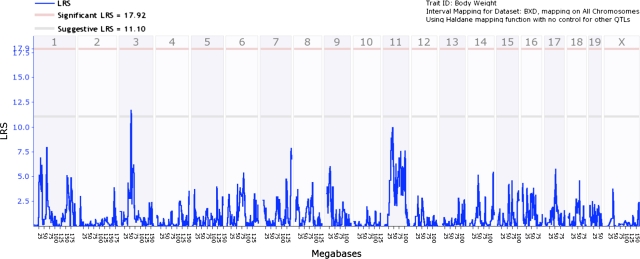
Figure 2.
Genome-wide linkage map of body weight. Blue trace shows the LRS for body weight. Note that a suggestive QTL was detected on chromosome 3. Lower gray horizontal line: suggestive LRS genome-wide threshold at P ≤ 0.63. Upper red horizontal line: significant LRS genome-wide threshold at P ≤ 0.05.

