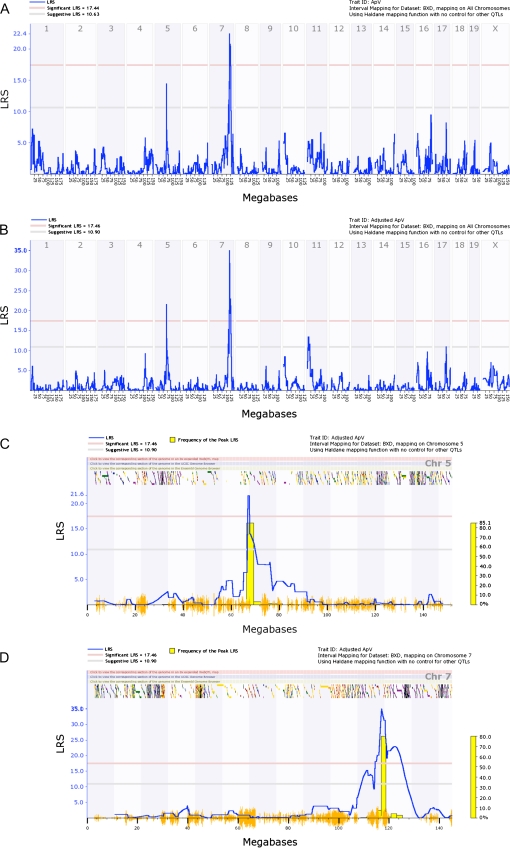
Figure 4.
Genome-wide linkage maps of tongue length (ApV). (A) Interval genome-wide QTL map using raw data showing a significant QTL on chromosome 7 and a suggestive signal on chromosome 5. When using adjusted values (B), the QTL on chromosome 5 crosses the significance threshold, whereas the QTL on chromosome 7 remains at relatively the same significance level. (C and D) interval QTL maps with bootstrap analysis of chromosomes 5 and 7 using adjusted ApV values, respectively. Lower gray horizontal line: suggestive LRS genome-wide threshold at P ≤ 0.63. Upper red horizontal line: significant LRS genome-wide threshold at P ≤ 0.05. Yellow histogram: frequency of peak LRS (bootstrap analysis). Orange seismograph marks indicate SNP density.

