
Figure 5.
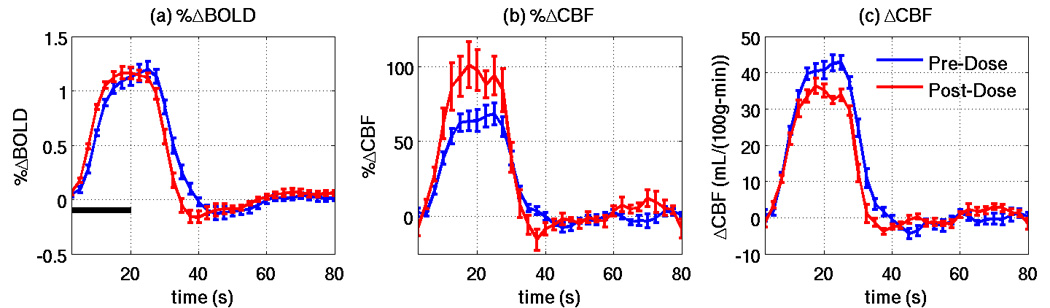
Pre-dose (blue lines) and post-dose (red lines) group average responses for (a) %ΔBOLD, (b) %ΔCBF, and (c) ΔCBF. Vertical bars show standard error, and the horizontal black bar indicates the visual stimulus.
Official websites use .gov
A
.gov website belongs to an official
government organization in the United States.
Secure .gov websites use HTTPS
A lock (
) or https:// means you've safely
connected to the .gov website. Share sensitive
information only on official, secure websites.
Pre-dose (blue lines) and post-dose (red lines) group average responses for (a) %ΔBOLD, (b) %ΔCBF, and (c) ΔCBF. Vertical bars show standard error, and the horizontal black bar indicates the visual stimulus.