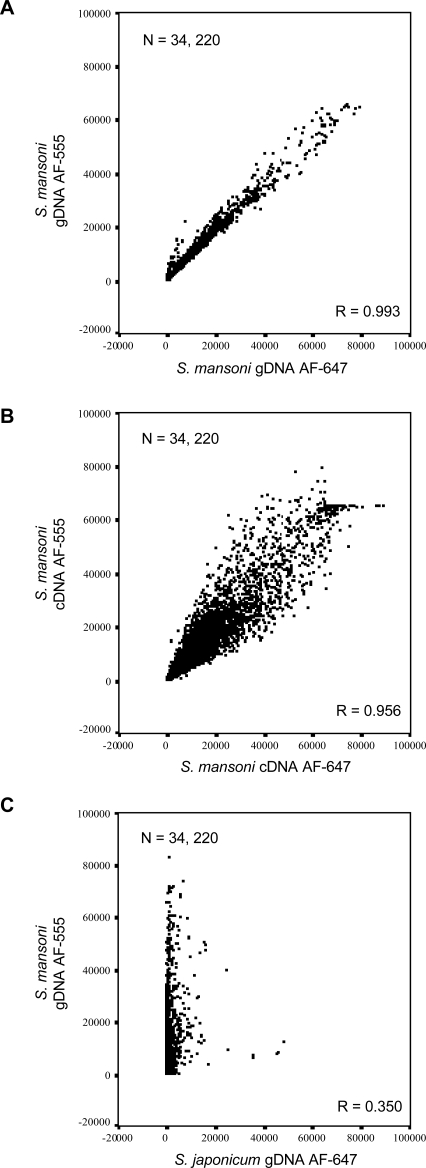
Figure 1. Long-oligonucleotide DNA microarray is specific for S. mansoni nucleic acid material.
S. mansoni gDNA hybridizes to the oligonucleotide DNA microarray with greater specificity and less variation compared to S. japonicum gDNA or a mixed pool of S. mansoni cDNA. Scatter plots display signal intensity for all oligonucleotides passing manual exclusion filters in all three displayed experiments. Correlation coefficient values for each comparison, R = 0.993, 0.956 and 0.350 indicate a high degree of correlation between AF555 and AF647 signal intensities from gDNA and cDNA, but not from S. mansoni AF555 labeled gDNA compared to S. japonicum AF647 labeled gDNA. A) Scatter plot for AF555 labeled S. mansoni gDNA compared to AF647 labeled S. mansoni gDNA signal intensities. B) Scatter plot for S. mansoni AF555 labeled cDNA compared to S. mansoni AF647 labeled cDNA (as described in Methods ) signal intensities. C) Scatter plot for S. mansoni AF555 labeled gDNA compared to S. japonicum AF647 labeled gDNA signal intensities. All negative control microarray signals were removed before analysis, microarrays were filtered for manually excluded spots and each experiment was subsequently filtered to contain the same number of spots (n = 34,220).

