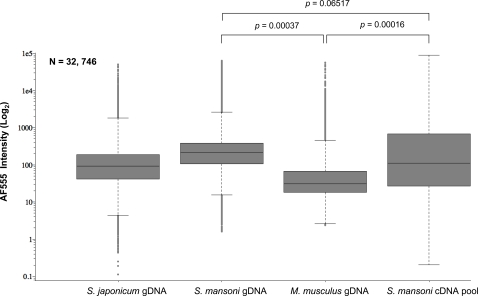
Figure 2. S. mansoni gDNA has superior hybridization characteristics compared to S. mansoni cDNA.
The use of S. mansoni gDNA as a common reference reveals higher median intensity values and narrower overall intensity distributions than a complex S. mansoni cDNA reference. Box-plots display signal intensities for the AF-555 channel for S. japonicum, S. mansoni, M. musculus gDNA and complex reference S. mansoni cDNA pool (as described in Methods ). Boxes represent three independent experiments for mouse gDNA, S. mansoni gDNA and S. mansoni cDNA pool, respectively. S. japonicum gDNA is represented by a single experiment. All negative control microarray signals were removed before analysis, microarrays were filtered for manually excluded spots and each experiment was subsequently filtered to contain the same number of spots (n = 32,746). Statistical significance was defined using a Student's t-test between three independently replicated experiments. Horizontal lines represent median oligonucleotide intensity, boxes display oligonucleotide elements 25% above and below the median value and whiskers show oligonucleotide elements within 1.5 deviations of the median. Outlier oligonucleotide intensity values (beyond 1.5 deviations) are illustrated as individual spots.

