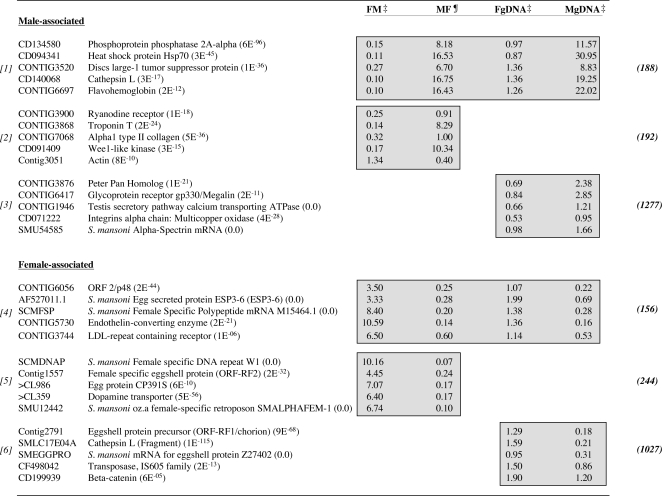
Figure 4. Representation of some differentially expressed, gender-associated cercariae transcripts, as identified through two distinct hybridization methods.
Numbers in parentheses represent BLASTx NCBI nr database annotation, numbers in bold parentheses represent the total number of transcripts identified as differentially expressed using that particular method and relate directly to Fig. 3-Venn diagram of differentially expressed transcripts. Gray shading highlights differentially expressed ratios as identified through the statistical methods indicated. [1] Male-associated transcripts as identified through direct ratio comparison of male and female cercarial cDNA samples and additionally identified indirectly using gDNA as a common denominator-male cDNA v gDNA compared with female cDNA v gDNA. [2] Male-associated transcripts as identified though a direct comparison only. [3] Male-associated transcripts as identified though an indirect comparison only. [4] Female-associated transcripts as identified through direct ratio comparison of male and female cercarial cDNA samples and additionally identified indirectly using gDNA as a common denominator-male cDNA v gDNA compared with female cDNA v gDNA. Gray shading highlights differentially expressed ratios as identified through the statistical methods indicated. [5] Female-associated transcripts as identified though a direct comparison only. [6] Female-associated transcripts as identified though an indirect comparison only. FM: Female AF647 v Male AF555 cDNA; MF: Male AF647 v Female AF555 cDNA; FgDNA: Female AF647 cDNA v gDNA AF555; MgDNA: Male AF647 cDNA v gDNA AF555. Expression ratios within columns represent a mean AF657/AF555 ratio for all experiments. ‡ denotes mean of three replicate experiments, ¶ denotes mean ratio of two replicate experiments.

