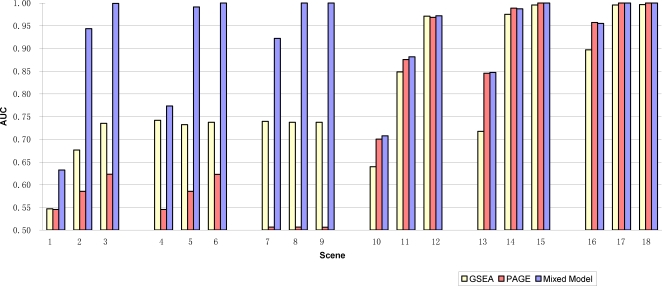
Figure 1. Area under ROC Curves (AUC) for the comparison of Mixed Model, PAGE and GSEA methods using simulated data.
For each scene, there were 20 simulated datasets, each with 1500 genes assigned to 50 gene-sets, among them only the first gene-set (gene-set 1) include genes associated with outcome by design. The test results from each method were compared with true classification of the gene-sets. The AUC measures the ability of a test to correctly classify whether a gene-set is associated with outcome. In scenes 1–9, when genes were shifted in both directions equally (up_p = 0.5), mixed model outperformed both GSEA and PAGE. In scenes 10–18, when most of genes were shifted in one direction (up_p = 0.8), mixed model and PAGE performed similar, and they both outperformed GSEA, especially when the magnitude of differential expression in gene-set 1 is small (scenes 10, 13, 16).

