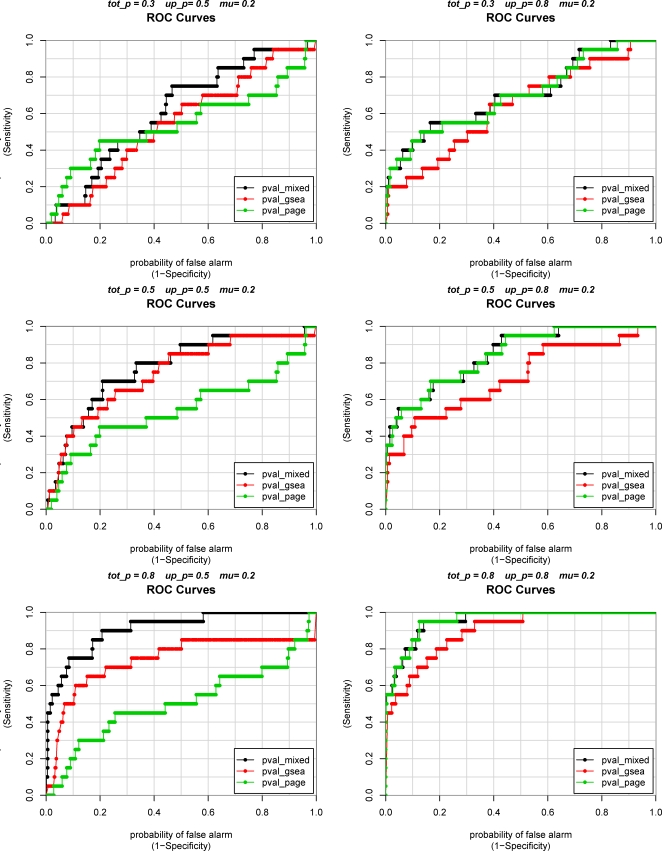
Figure 2. Receiver Operating Characteristic Curves for Mixed Model, GSEA and PAGE using simulated data.
tot_p = proportion of genes with treatment effect added to treatment group in gene–set 1; up_p = among treated genes, the proportion of genes for which positive treatment effect mu was added; 1−up = among treated genes, the proportion of genes for which negative treatment effect –mu was added. See text for details of simulation experiment.

