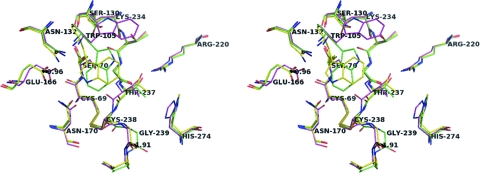
FIG. 4.
Superimposition at the level of the binding cavity of the three KPC-2 structures determined in the present study (KPC-2 in yellow and the C-ter-deleted mutant in green) and by Ke et al. (26) (in magenta). Oxygen and nitrogen atoms are in red and blue, respectively. The distances are indicated by dashed lines and are given in Å.

