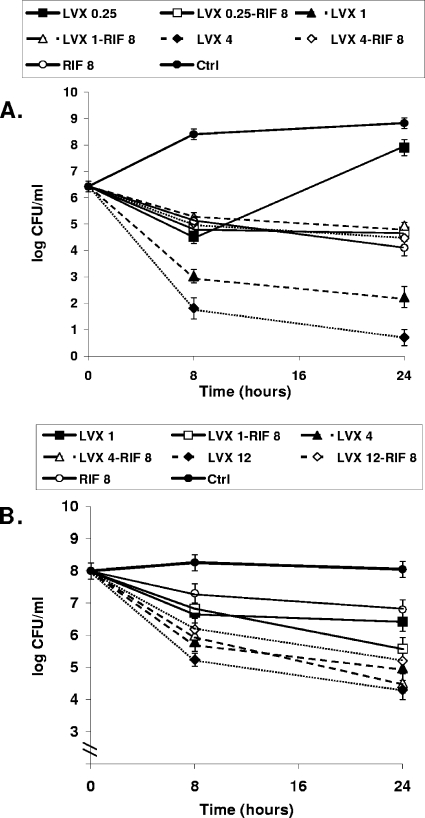
FIG. 1.
Time-kill curves for strain in the log phase obtained with subinhibitory and clinically available concentrations (μg/ml) (A) and in the stationary phase obtained with the trough and peak concentrations (B) in TCF of rats treated with levofloxacin (LVX) alone and in combination with rifampin (RIF). Note that the levofloxacin concentrations used in the log-phase studies were lower than those used in the stationary-phase studies. In the stationary-phase studies, the trough concentrations of levofloxacin were equivalent to the subinhibitory ones in the log phase, whereas two peak concentrations of levofloxacin are represented as being equivalent to the peak levels of both dosages. The antagonistic effect obtained with the combination of levofloxacin and rifampin in the log phase was observed with levofloxacin at concentrations of 1 and 4 μg/ml (LVX 1 and LVX 4, respectively), whereas the combination of levofloxacin at 12 μg/ml (LVX 12) and rifampin in the stationary phase decreased the efficacy of levofloxacin at 12 μg/ml alone by more than 1 log CFU/ml. Errors bars indicate standard deviations; in some cases, the bars are smaller than the symbols and so cannot be seen.

