FIG. 2.
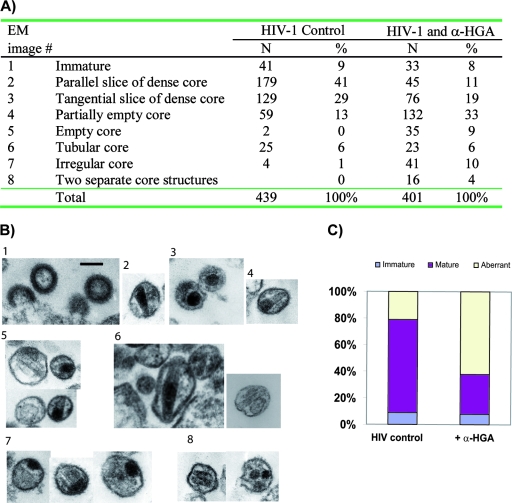
Effect of α-HGA (at 10 μM) on virion morphology. (A) Enumeration of virus core structures with respective morphology (numbered 1 to 8). A total of 439 virus particles obtained from untreated and 401 virus particles obtained from α-HGA-treated HIV-1 SF-2-infected H9 cells were analyzed by TEM. (B) Typical examples of TEM images representing the various core morphologies depicted in panel A obtained in the absence or presence of α-HGA. Scale bar, 100 nm. (C) The bars depict the relative number of immature virus particles, the virus particles with a mature and normal appearance, and those with aberrant core morphology.

