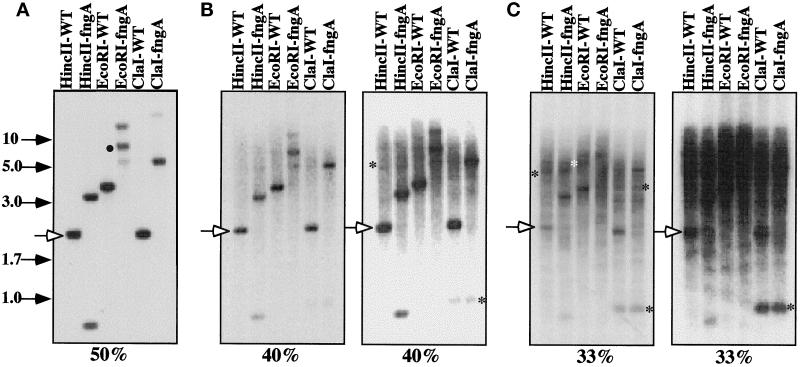
Figure 1.
Southern blot of wild-type and ubcB-null cells. Genomic DNA isolated from wild-type cells and ubcB-null cells was digested with the restriction enzymes shown and analyzed by Southern blot hybridization as described previously at different hybridization stringencies (Nellen et al., 1987). (A, 50% formamide) The solid circle marks the proper UbcB gene band for this digest. (B, 40% formamide) The two panels are different exposures of the same filter. (C, 33% formamide) The same batch of restriction enzyme-digested DNA was used for each hybridization. The two 40% and 33% formamide panels are different exposures of the same filter. The positions of size markers (in kb) are shown. See MATERIALS AND METHODS for details. The open arrowhead marks the position of a common band (wild-type HincII band). The asterisks mark the positions of some bands not seen in the high stringency (50% formamide) hybridization blot but which appear in the lower stringency hybridizations.

