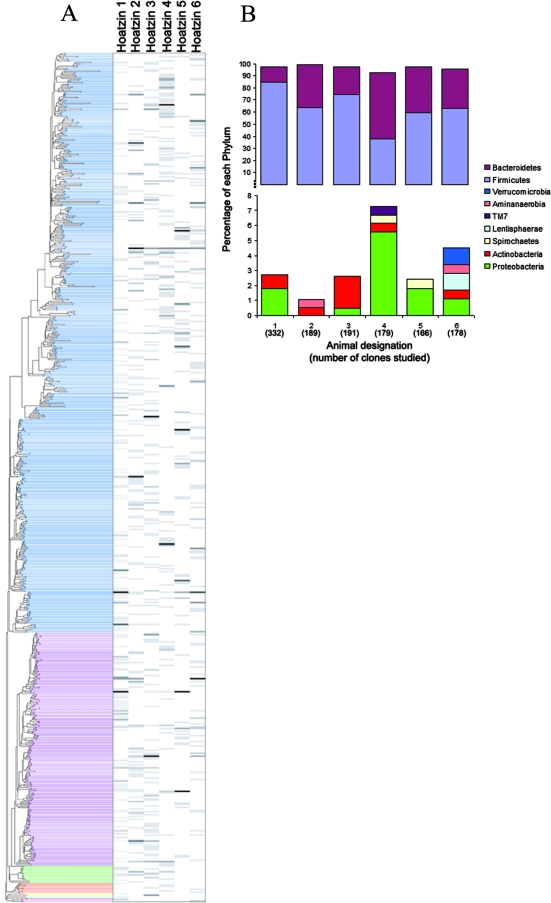
FIG. 2.
Phylogenetic analysis of the hoatzin crop bacteria. (A) Tree of the 580 identified bacterial OTUs, showing relative clone abundance for six individual animals. In the neighbor-joining tree, the lines on the left indicate OTUs and the columns on the right show data for animals. The phyla are color coded as described in Fig. S1 in the supplemental material and (from top to bottom) are Firmicutes, Bacteroidetes, Proteobacteria, Actinobacteria, Spirochaetes, Lentisphaerae, Verrucomicrobia, TM7, and Aminanaerobia. The relative clone abundance for each OTU in each animal is indicated by a shade of gray (white, 0%; black, 100%). (B) Distribution of the 1,235 16S rRNA gene sequences in nine bacterial phyla for individual hoatzins. Data for the two phyla represented most often, Bacteroidetes and Firmicutes, are shown in the top panel, and data for the other seven phyla are shown in the bottom panel. Proteobacteria were the predominant bacteria in animal 4 but were absent in animal 2, whereas Verrucomicrobia and Lentisphaerae were detected only in animal 6.

