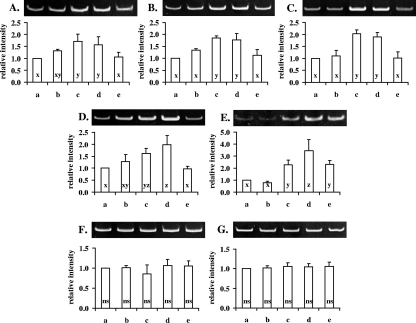
FIG. 2.
Confirmation of differential gene expression by RT-PCR analysis. RT-PCR was performed with RNA extracted from nonadapted or acid-adapted cells, using primers specific for each of the transcripts coding for the mannose-specific IID component (A), the 1,2-diacylglycerol 3-glucosyltransferase (B), the 3-oxoacyl-acyl carrier protein (C), the large subunit of carbamoyl-phosphate synthase (D), a hypothetical protein (E), and 16S (F) and 23S RNA (G). The intensity of each band relative to that of the control (first lane of each gel) was calculated after densitometric analysis. Lanes of each gel are identified in accordance with the columns of the corresponding charts: nonadapted control cells (a), autoacidified cells (b), transiently adapted cells (c), acid-habituated cells (d), and stationary-phase cells (e). The relative intensities of bands of a specific transcript that do not differ significantly (Tukey's test, P < 0.05) are noted with the same letter (x, y, or z). For 16S (F) or 23S RNA (G) transcripts, ANOVA (at P < 0.05) revealed no significant difference (ns) among the relative band intensities.

