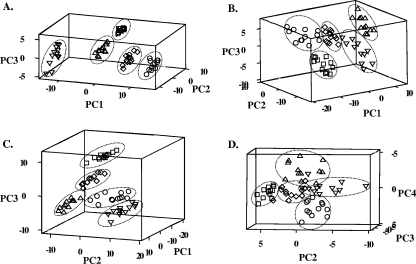
FIG. 5.
PCA of second-derivative-transformed spectra in the four characteristic spectral regions (panels A to D, corresponding to regions I to IV) of S. macedonicus acid-tolerant phenotypes and the nonadapted control. For each of the phenotypes, 12 independent samples were analyzed. In all cases, nonadapted (○), autoacidified (□), transiently adapted (⋄), acid-habituated (▵) and stationary-phase (▿) cells formed distinct groups.

