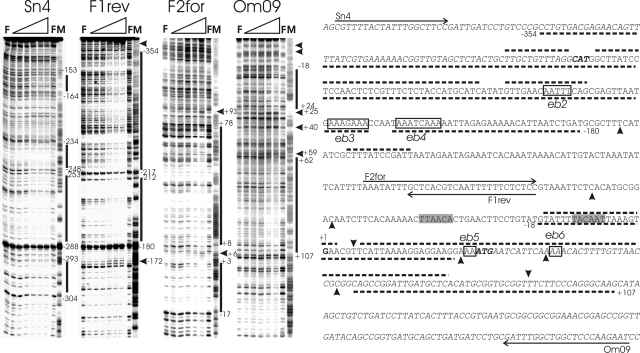
FIG. 3.
DNase I footprinting analysis of AbrBsub at the phyCFZB45 promoter region. The footprints of the coding and noncoding strands obtained with fragments F6 (Sn4 and F1rev) and F4 (F2for and Om09) in the presence of increasing concentrations of AbrB can be seen in the four panels on the left. The AbrB concentrations were 0 μM (for lanes F) and 0.5 μM, 1 μM, 2 μM (missing for fragment F4), 4 μM, 6 μM, and 8 μM (from left to right for the lanes marked with gradients). M indicates the corresponding A+G (Maxam-Gilbert) sequencing reaction. The protected and hypersensitive sites are marked with bars and arrowheads, respectively. The corresponding sequence of the phyC intergenic region is shown on the right. Protected areas of AbrB are delineated by dotted lines, and hypersensitive sites are shown by filled arrowheads (top, coding strand; bottom, noncoding strand). The phyC and yodU coding regions are indicated in italic letters, and the −10 and −35 promoter sequences are shaded. Binding sites within AbrB binding regions 1 and 2 (eb2, eb3, eb4, eb5, and eb6) are framed and labeled.

