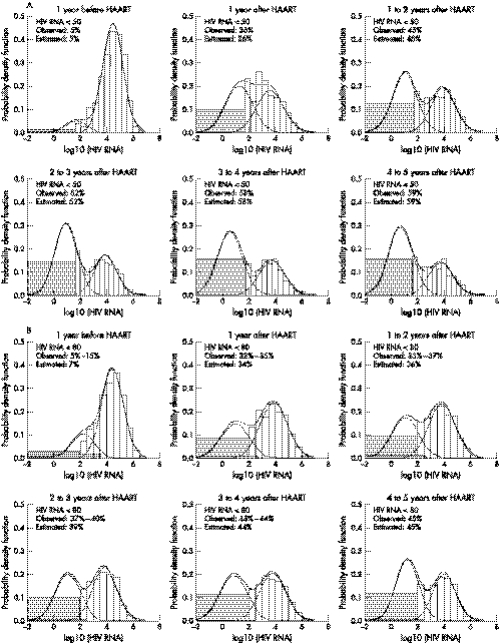
Figure 2 Goodness of fit for modelling log10(HIV RNA) as a mixture of two normal distributions with equal variance for the MACS (panel A) and the WIHS (panel B), respectively. The histograms are observed data and the lines are fitted values. Shaded areas depict the observations below the limits of detection (LD). LD is 50 HIV RNA copies/ml (log10(50) = 1.7) in the MACS, and is 80 (log10(80) = 1.9) or 400 or 4000 HIV RNA copies/ml in the WIHS. The observed % below 80 in the WIHS ranges from the percentage <80 copies/ml alone to the sum of the percentages of undetected HIV RNA <80, or <400, or <4000 copies/ml.

An official website of the United States government
Here's how you know
Official websites use .gov
A
.gov website belongs to an official
government organization in the United States.
Secure .gov websites use HTTPS
A lock (
) or https:// means you've safely
connected to the .gov website. Share sensitive
information only on official, secure websites.
