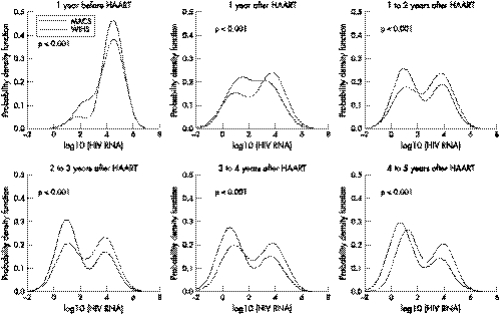
Figure 3 Superimposed estimated bimodal distributions of log10(HIV RNA in copies/ml) for the MACS and WIHS by different years from HAART initiation. Negative values on the x axis represent less than 1 copy/ml (for example, −2 corresponds to 1 copy/100 ml). The solid line is for the MACS and the dashed line is for the WIHS. The p value in each panel was obtained from likelihood ratio test to examine whether the mixture distributions from the two cohorts were different.

An official website of the United States government
Here's how you know
Official websites use .gov
A
.gov website belongs to an official
government organization in the United States.
Secure .gov websites use HTTPS
A lock (
) or https:// means you've safely
connected to the .gov website. Share sensitive
information only on official, secure websites.
