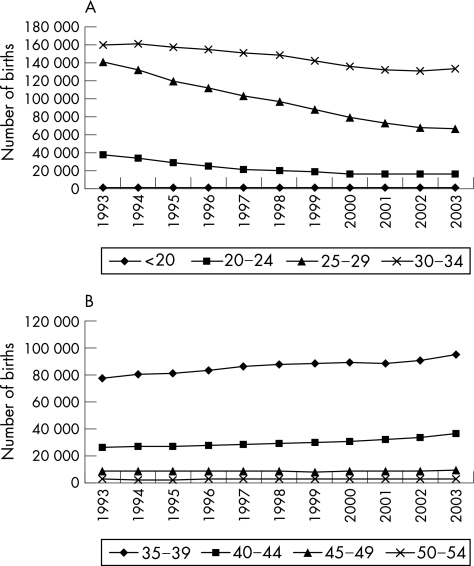
Figure 1 Trends in paternal age for live births within marriage in England and Wales, 1993–2003: (A) decreasing trends <35 years, (B) increasing trends 35–54 years. Source: Series FM1 no 32 (ONS, 2003). (Births to fathers over 54 years account for less than 0.5% of live births within marriages and are not shown).

An official website of the United States government
Here's how you know
Official websites use .gov
A
.gov website belongs to an official
government organization in the United States.
Secure .gov websites use HTTPS
A lock (
) or https:// means you've safely
connected to the .gov website. Share sensitive
information only on official, secure websites.
