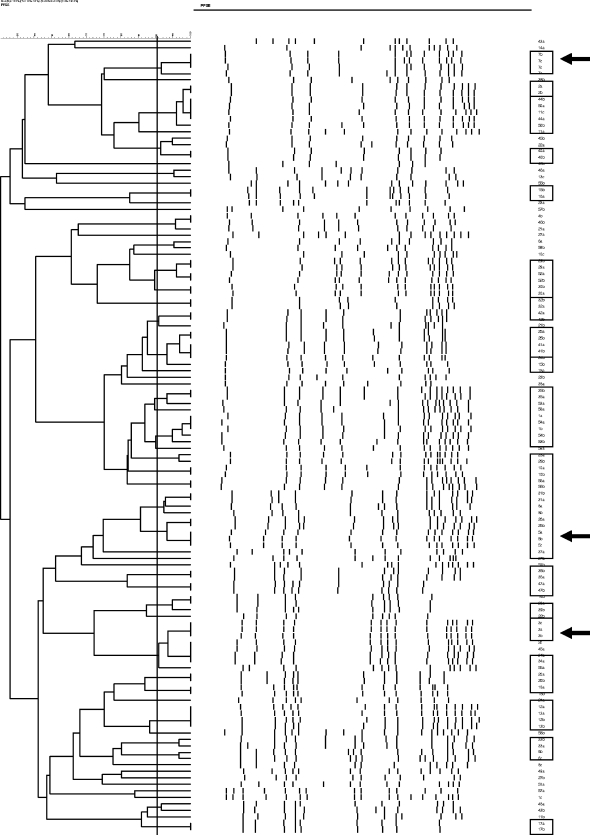
FIG. 2.
S. aureus dendrogram. PFGE analysis was performed for all strains derived from infants with two or more cultures that tested positive for S. aureus. The banding patterns are shown in the central portion of the figure. On the left, the percentage of strain relatedness is indicated in the form of a BioNumerics-generated dendrogram. A cut-off percentage of 90% (vertical solid line) is used to identify similar to identical strains. Strains meeting this criterion and derived from the same infant are indicated by boxing in the right column, which identifies children by study number and by the first (a), second (b), and third (c) culture moment. In three cases, the strains isolated at the three culture moments were identical (arrow).

