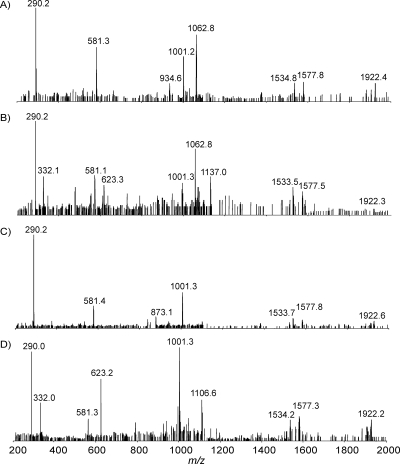
FIG. 7.
MS/MS analysis of intact LOS from C. jejuni MF6 (single colony). All experimental conditions were the same as those for Fig. 3. (A) Extracted MS/MS spectrum of the ion with an m/z of 1,126.7 ([M-4H]4−); (B) extracted MS/MS spectrum of the ion with an m/z of 1,137.0 ([M-4H]4−); (C) extracted MS/MS spectrum of the ion with an m/z of 1,096.0 ([M-4H]4−); (D) extracted MS/MS spectrum of the ion with an m/z of 1,106.5 ([M-4H]4−).

