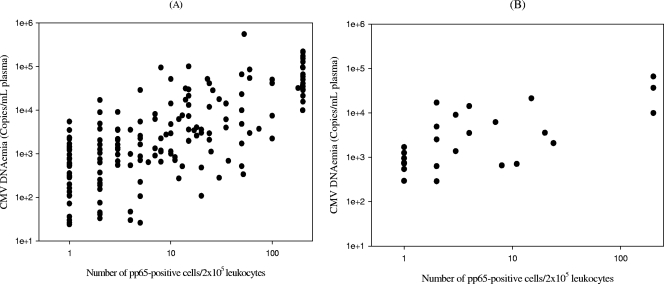
FIG. 1.
Scatter diagrams (log10 scale) show the correlation between plasma CMV DNA levels and pp65 antigenemia values (number of pp65-positive cells/200,000 leukocytes examined) among all samples testing positive by the real-time PCR assay and the antigenemia assay during the study period (r = 0.501, P < 0.001, by the Pearson test) (A) and among samples drawn prior to the initiation of preemptive therapy testing positive by both methods (r = 0.789, P < 0.001, by the Pearson test) (B).

