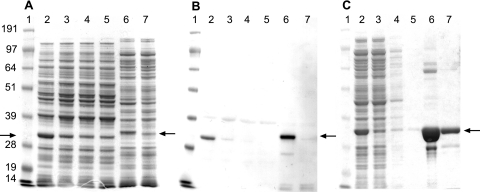
FIG. 3.
(A) Gel analysis of crude protein lysates from E. coli and L. lactis expressing ΦCD27 endolysin and empty vector controls. Lanes: 1, SeeBlue marker (Invitrogen); 2 to 5, lysates from L. lactis containing pUK200His-cd27l (2 and 3) or pUK200His (4 and 5) with (2 and 4) or without (3 and 5) nisin induction; and 6 and 7, lysates from E. coli containing pET15b-cd27l (6) or pET15b (7), both with IPTG induction. Arrows indicate the His-tagged endolysin—when it is expressed from pET15b-cd27l with the His tag MGSSHHHHHHSSGLVPRGSH, the size is ca. 32 kDa, and when it is expressed from pUK200His-cd27l with the His tag MSHHHHHHA, the size is ca. 31 kDa. (B) Western analysis of the gel in panel A with a six-His tag antibody. (C) Gel analysis of Ni-NTA column-purified His-tagged endolysin from E. coli expressing pET15b-cd27l. Lanes: 1, SeeBlue marker; 2 to 5, E. coli(pET15b-cd27l) total protein extracts after 5 h of induction with IPTG; 2, crude lysate; 3, column flowthrough; 4, primary wash effluent; 5, secondary wash effluent; 6, primary eluate (E1); and 7, secondary eluate (E2). Crude protein lysates were loaded at 10 μg of total protein per lane, while lanes loaded with samples from Ni-NTA column fractionation contained 6.5 μl per lane.

