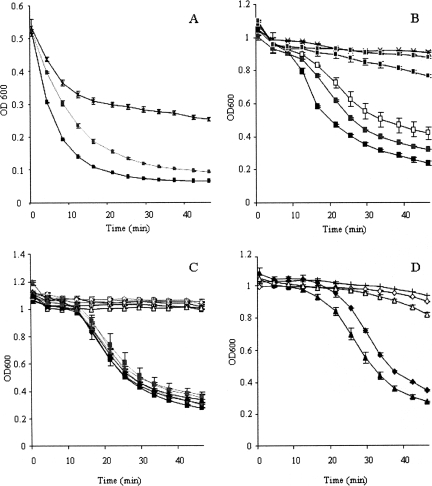
FIG. 4.
Lysis assays with cells of C. difficile strain 11204. Cells were grown to mid-exponential phase, harvested by centrifugation, and then either flash-frozen in liquid nitrogen and stored at −20°C before being assayed (A) or used immediately (B to D). Cells were incubated with Ni-NTA column-purified endolysin (E1) from E. coli expressing CD27L from pET15b-cd27l (A to C) or with crude protein extracts (D). (A) Effect of CD27L (7 μg, black squares, or 0.7 μg, gray squares) on frozen cells compared to that of the buffer control (EB; x's). (B) Effects of different amounts of CD27L (10.5 μg, black rectangles; 3.5 μg, gray rectangles; 0.7 μg, white rectangles; 0.35 μg, black squares; and 0.07 μg, gray squares) on fresh cells compared to that of the buffer control (EB; x's). (C) Activity profile of CD27L (black symbols) compared to that of the buffer control (EB; white symbols) tested at pH 4.5 (black squares), 5.8 (gray squares), 6.5 (black diamonds), 7.0 (gray diamonds), 7.6 (black triangles), and 8.3 (gray triangles). (D) Lysis of cells incubated with 50 μg of crude protein extracts from E. coli expressing pET15b-cd27l (black triangles) or pET15b (white triangles) or from L. lactis expressing pUK200His-cd27l (black diamonds) or pUK200His (white diamonds) or with the TN buffer control (plus signs). Values are the means of results from duplicate assays ± standard deviations.

