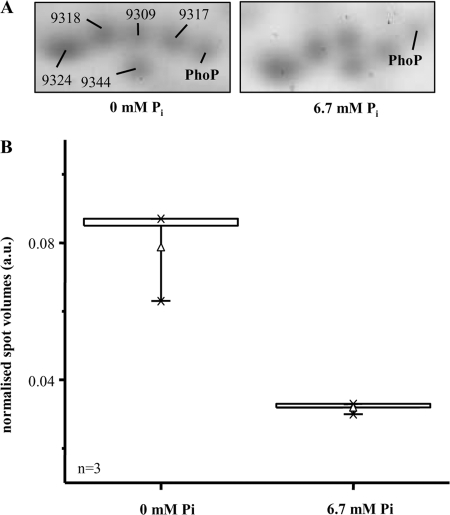
FIG. 4.
Expression of PhoP under different phosphate concentrations. (A) Shown are sections of 2-DE gels with PhoP proteins with a surplus of Pi (6.7 mM) or Pi limitation (0 mM). The lines mark the spots of PhoP. The other spots serve orientation purposes (9309, dihydrodipicolinate reductase [dapB, cac2379]; 9317, acetoacetate decarboxylase [adc, cap0165]; 9324, triosephosphate isomerase [tpi, cac0711]; 9344, adenylate kinase [adk, cac3112]; 9318, not identified [score below 65]). (B) Distribution of normalized spot volumes (arbitrary units [a.u.]; n = 3) for PhoP (see Fig. 4A) are shown as box-and-whisker plots. The boxes represent the upper and lower quartiles. The separation line in the box marks the 50% value (mean; not visible). The whiskers indicate the 5th and 95th percentiles, respectively. Average values are depicted as little triangles. Upper and lower extreme values are indicated with a minus sign. The × symbol shows the 99% and 1% range of the individual values, respectively.

