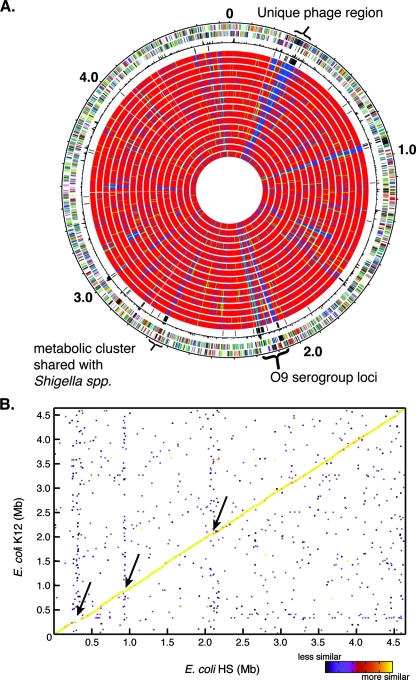
FIG. 1.
Gene content and synteny of the commensal isolate E. coli HS. (A) Gene conservation using E. coli HS as the reference strain. Starting from the outside, the first circle shows the genes in the forward orientation. The second circle shows the genes in the reverse orientation relative to the origin. The third circle shows the chi-square values, representing differences in the local G+C content. The fourth circle shows all of the genes that are unique to E. coli HS. Circles 5 to 20 show the gene conservation in all of the other E. coli genomes compared in the following order: MG1655, W3110, E24377A, B7A, EDL933, Sakai, CFT073, F11, UTI89, 536, E22, E110019, B171, Ec042, 101-1, and APEC01 (Table 1). The color indicates that a gene is present (red), divergent (green), or absent (blue). Three additional regions which are unique to E. coli HS are indicated: one phage region (∼0.3 Mb) that is not shared with any of the other sequenced strains, the serogroup O9-specific region (∼2.1 Mb), and one additional cluster that is shared only with Shigella species (∼2.6 Mb). (B) Gene synteny (conserved gene order) for E. coli HS and E. coli K-12. The color indicates the level of similarity between regions, as shown by the scale on the lower right. The arrows indicate three regions of diversity for these genomes. The upper and lower arrows indicate the unique phage and the O9 serogroup cluster. Overall, there is a great deal of synteny between the two genomes. A similar pattern was observed for most other complete genomes; the exception was the EHEC strain EDL933 genome, which contains a single large inversion.

